I am currently looking into the readability of articles in certain types of newspapers; broad-sheet, tabloid and local newspapers. I use the scales of readability, giving after a grammar check Microsoft Word.
Here are over 60 articles from newspapers in US and UK. The Flesch scale is given as this represents a sound scale of readability, the lower the percentage, the more experienced the reader needs to be to understand the article, a high percentage means basic, short words are frequently used making it understandable by a large number of people. Tabloids are noticably easier to read and Broad Sheets are aimed at a people with higher language skills.
This is taken from MSWord Help on grammar checking formulae: The Flesh index computes readability based on the average number of syllables per word and the average number of words per sentence. Scores range from 0% to 100%. The average writing score is approximately 60% to 70%. The higher the score, the greater the number of people who can readily understand the document.
If any newspapers do not wish their articles' readability to be shown, use the form below. None of the articles are stored on my computer as they were deleted after checking for grammar, the article titles have been abreviated to save loading time of page. My catergorising of Tabloids and Broad Sheets may not be completely correct as newspapers do not always state which type they are. Some newspapers don't fall into these categories, but I have placed them into two groups for the purpous of anylising with as few variables as possible.
The purpose of this investigation is to judge the readability of two types of newspapers: Broad Sheets and Tabloids. I will collect at least 50 pieces of raw data for this investigation in order to answer some questions.
- Which newspapers are read by a wider audience?
- Does the difficulty of the language determine what type of people read the newspaper?Newspapers with a low readability are aimed at people would can understand longer words and long sentences. Low readability newspaper articles usually contain words with many syllables.
High readability newspaper articles can be understood by a greater range of people with varying intellect. Shorter words, sentences are concise and contain words with few syllables, making it generally easier to comprehend.
Article readability, I feel, is worthy of study as it will determine what audience the paper is aimed at, and whether or not Broad Sheets will clearly have a lower readability than Tabloids newspapers, which could be aimed at a greater population. It will be interesting to understand how certain people like to read certain types of newspaper.
Newspapers articles will be taken from a search of newspapers on the internet. In each newspaper, the headlines will be copied and analysed with the grammar check in MS Word. Results from the grammar check will be typed into a database, where the most representative readability formula will be chosen as the numeric variable for this investigation. The search engine Yahoo can be instructed to randomly find a Tabloid and Broad Sheet newspapers on the internet. This made the newspaper site selection random. Yahoo categorises web sites depending on the material contained on them, Broad Sheets and Tabloids are found under two different categories, making the process of finding different types of article easier. An equal number of articles of each type will be used, for this investigation I will use 35 for each type of newspaper, making a total 70 articles to be analysed for their readability. I will use the first two articles found on the online newspaper to be included for checking of readability, repeated article subject matter will not be included to ensure a greater variation of data. The parent population from which I may choose to collect the data from, is undefined. There is no way of finding how many newspaper articles can come from either Broad Sheet or Tabloid newspapers. The number of newspaper articles, in UK or US and published on the internet, is the parent population in this investigation.
There was a large population to find articles for the Broad Sheets category, many UK national papers also have their own web site, where the paper can be read free of charge. Tabloids were more scarce and I had to use US Tabloids in order to have a large enough population to choose from. The articles were copied to MS Word, where they were grammar checked, a large amount of the newspaper articles used are included in this investigation. Data was stored and sorted using a database table in MS Access. There was a great amount of data obtained from the grammar check of each article, the vast majority was unnecessary, as it did not convey readability or the paper type. I have chosen the Flesch readability scale as this incorporates all the points mentioned in the Aim (word, sentence length and syllables per word). This numeric data is calculated out of 100, but all the data lies in the centre of the possible range from 33.8 to 77.3. Here is an explanation of each of the readability formulas found after a grammar check:
Flesch Reading Ease - This index computes readability based on the average number of syllables per word and the average number of words per sentence. Scores range from 0 to 100. The average writing score is approximately 60 to 70. The higher the score, the greater the number of people who can readily understand the document.
Flesch-Kincaid Grade Level - This index computes readability based on the average number of syllables per word and the average number of words per sentence. The score in this case indicates a US grade-school level. For example, a score of 8.0 means that an eighth grader would understand the document. Standard writing approximately equates to the seventh-to-eighth-grade level.
Coleman-Liau Grade Level - This index determines a readability grade level based on characters per word and words per sentences.
Bormuth Grade Level - This index also determines a readability grade level based on characters per word and words per sentences.
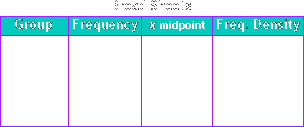
The reading ease of an article is the formula I want to use in comparing Broad Sheet and Tabloid newspapers, so the Flesch Reading Ease will be used. Here is a table of 35 articles, for each type of newspaper, with their Flesch reading ease from lowest to highest in each category. This table will be used as a source for displays and analysis.From the table, a frequency table was drawn up, with class sizes of 10, in order to represent data as a histogram. I have used class sizes of 10 because outliers are more likely to be incorporated in the main distribution of the histogram A stem and leaf diagram would not be a suitable method of displaying grouped data of the Flesch reading ease as there are decimals over a large range and having a leaf for each integer would spread the data out too far for any meaningful analysis. If I were to round data to the nearest integer, and then plot a stem and leaf diagram data values would be changed, possibly making findings less accurate. A histogram shows the spread of grouped data, but decimals have no effect on the group size.
The frequency density is the frequency divided by the class width (evenly spaced group sizes of 10).

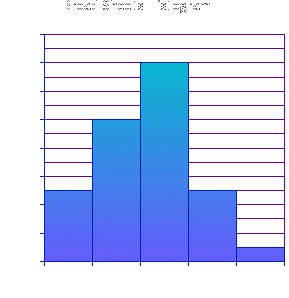
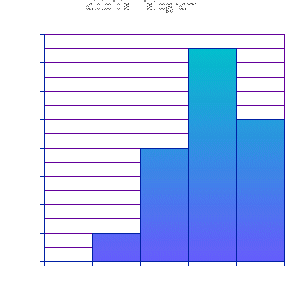
There appears to be a unimodal distribution in both sets of data, there is only high frequency in each group and the frequency falls either side of the modal group. From the frequency table the following histograms have been produced, the y axis shows the frequency density and the x axis is the Flesch reading ease in groups of 10. Both histograms are identical in size and scale on both axis, and are opposite each other for easy comparison.


The distribution of the Broad Sheets histogram is positively skewed while the Tabloids histogram is negatively skewed and are both unimodal. The modal class of the Broad Sheets is: 50 £F<60 and the Tabloids is the class: 60 £F< 70. There are no outliers shown on either histograms. The histograms are quite evidently different, meaning that the two types of papers are aimed at different reading abilities. Tabloids, from looking at the histograms, are generally easier to read, while Broad Sheets are mainly aimed for people who can understand more complicated words and phrases. The standard deviation of the article readability for each type of newspaper would be very useful for analysing the average spread of the data and deciding whether Broad Sheets are more consistently harder to read than Tabloid newspapers. Standard deviation shows the average spread of the data from the mean. I have used class sizes of 5 to calculate the standard deviation as this is more accurate for this purpose, than the larger groups of 10, used for the histograms to show the shape of the distribution. The mean of Broad Sheets = 50.36 and Tabloids = 64.5

The standard deviation for both types of newspaper is quite similar, but the average spread of the data of the Broad Sheets' readability is greater than the Tabloids'. Therefore, the Tabloids are more consistently easier to read than the Broad Sheets, which are slightly less consistently harder to read.
As both sets of data are skewed, the Broads Sheets: negatively skewed and Tabloids: positively skewed, it would be appropriate to find the median and interquartile range. Median is a good personification of the measure of data as it is not effected by outliers (in this case uncommon values of readability ease), I am looking for the typical value for each newspaper type. The process of calculating the median for the readability ease of Broad Sheets and Tabloids is shown below...


The interquartile range is also useful, in this instance, it represents only the data found in the central half of the whole range, and shows the difference between a representative low and high value. The process of calculating the interquartile range for the readability ease of Broad Sheets and Tabloids are shown below...


The interquartile range shows similar results to the standard deviation. The range between the typical high and low values are greater with the Broad Sheets, the Tabloids show a lowers interquartile range, showing that the data is more densely packed near the median, compared to Braod Sheets. The lower readability of Broad Sheets is less consistent than the higher readability of the Tabloids, as shown earlier by the standard deviation.
There has been a very clear difference between Broad Sheet and Tabloid newspapers. The readability ease of the Broad Sheets is much more difficult as longer sentences are used in the articles. Tabloids articles use less complicated language, resulting in a consistently higher Flesch readability ease, this is shown well by the two side-by-side histograms of Flesch readability ease. I anticipated this result as I have read many articles from both types of newspapers. From my own experience I have found Tabloids quite easy to understand as the facts and views, in the article, are put forward simply, using short words and sentences. Broad Sheet newspaper articles, I usually find more difficult to read, but there is often much more information packed into one sentence. The standard deviation is an accurate measurement of which type of newspaper is aimed at a wider audience, there is a similar result for the Broad Sheets (9.11) and the Tabloids (8.12). Broad Sheets are aimed at a wider audience as it has a greater average spread from the mean. Looking at the real-life application of the standard deviation, one must consider the percent of population which would have little trouble in reading lower readability newspapers. I do not have these figures, so I cannot conclude which type of paper is read by a greater population. I would assume Tabloids as they can be easily understood by readers who understand shorter words and less complicated sentences as well as competent readers. Broad Sheets, which are usually harder to understand, will normally be read only by readers who understand longer words and sentences.
The readability of the newspaper does determine who reads the paper, Broad Sheets are probably read by people who can easily understand low readability articles, and Tabloids are often read by people who find it difficult to read articles with a low readability and read high readability articles found in Tabloid newspapers. I believe this data was worth collecting, even if it took a long time to obtain from the internet, grammar check and sort in a database. It is essential in showing how Broad Sheet and Tabloid newspapers have different readability levels. I believe that this data is a good representation of the parent population of newspapers in the UK and US as I have obtained Flesch readability ease data from a total of 70 individual newspaper articles. 70 pieces of data should be satisfactory to obtain patterns in data from which a accurate conclusion can be deduced.
Looking at the table of results I found one outlier article in the Broad Sheets' readability: "Cheap Holiday? Take a Sheep", it had almost 10 more on the Flesch scale than the previous article (sorted in ascending order). This outlier was hidden when the data was grouped into class sizes of 10. On reading the article I discovered that the article [Cheap Holiday? Take a Sheep] was written as a homourous and Tabloid-style article, denoted by the heading. As I have a reasonable amout of data, this reduces the effect of this outlier on the sample population. There was no reason to remove the data, it is valid as it was found in a Broad Sheet newspaper. There would have been a bias in the a Without looking at the real-life application of the standard deviation I would say the data due to the material available on the internet. I found collecting Broad Sheet newspaper articles was not too difficult as there were many Broad Sheet papers in the category in Yahoo (internet search engine). Find Tabloid articles was very difficult as there are very few in the UK and a small list available in the US. Broad Sheet newspapers are very up-to-date with internet technology, almost every Broad Sheet sold in the UK has its own web site. Tabloids are less keen to build web sites and continually updating the site, when their newspapers are published. Besides The Mirror and local Tabloids, there was a very short list for Yahoo to choose from, when making random searches - resulting in repetitions of search results. When I included US Tabloids there was just enough Tabloids available to retrieve a varied sample of article from different newspapers. I must consider the effect of the US newspapers articles included in this investigation as US English is different from UK English and articles are written in a different style. Fortunately, Flesch readability ease is unbiased by language irregularities as it only takes into consideration: syllables per word and the average length of sentences, which is almost unaffected by word order, spelling etc. If I wanted to extend this work I would manually copy and grammar check more newspaper articles, trying to obtain an equal number of US newspapers for each newspaper type, eliminating the possibility of having a US/UK English bias in the Flesch reading ease results. The method of finding articles on the internet is also biased as some papers will be excluded from the list as they have no web site. The actual selection of articles to include from a newspaper once the web site is visited is quite inaccurate. The method used for data collection for this investigation has been to take the first 2 articles, the subject matter of which haven't been obtained elsewhere previously. An example a random, almost unbiased method of data collection would be:
Not use the internet to collect a limited set of data
Select all newspapers on a certain date
Have a numbered list all articles in newspapers
Use the random function on a calculator to select an equal sample of articles for each type of newspaper
Only to use UK national newspapers
This set up would involve a massive amount of tedious listing of all the Broad Sheet and Tabloid newspapers in the UK on a certain date, and then copying of the randomly chosen articles for grammar checking. The parent population in this investigation would be of all the Broad Sheet and Tabloid newspapers in the UK.